🟦 Home Assistant
Dashboards
In an ideal world you don't need any dashboards as the automations should either take action or notify you of abnormal states. Regardless, a nice looking dashboard is satisfying to make, look at, and monitoring how your systems are performing.
Homelab
The main dashboard I access is the Homelab dashboard. I mostly use Mushroom cards for single values, and the mini-graph-card for any graphs.
The reason I created this dashboard and the primary use case is as a "homepage" for other services. As the number of services I hosted increased, I found it increasingly difficult to remember the IP addresses. There are solutions that map a proper domain name to an IP address, eg:
- setting a Unifi local DNS record
- installing Tailscale and using Magic DNS
- using Cloudflare Tunnels
However I settled on a page of bookmarks as this could display other interesting information. There are also apps specifically for this purpose like Homarr or Homepage but I was both already familiar with Home Assistant and it already contained heaps of data about my home setup.
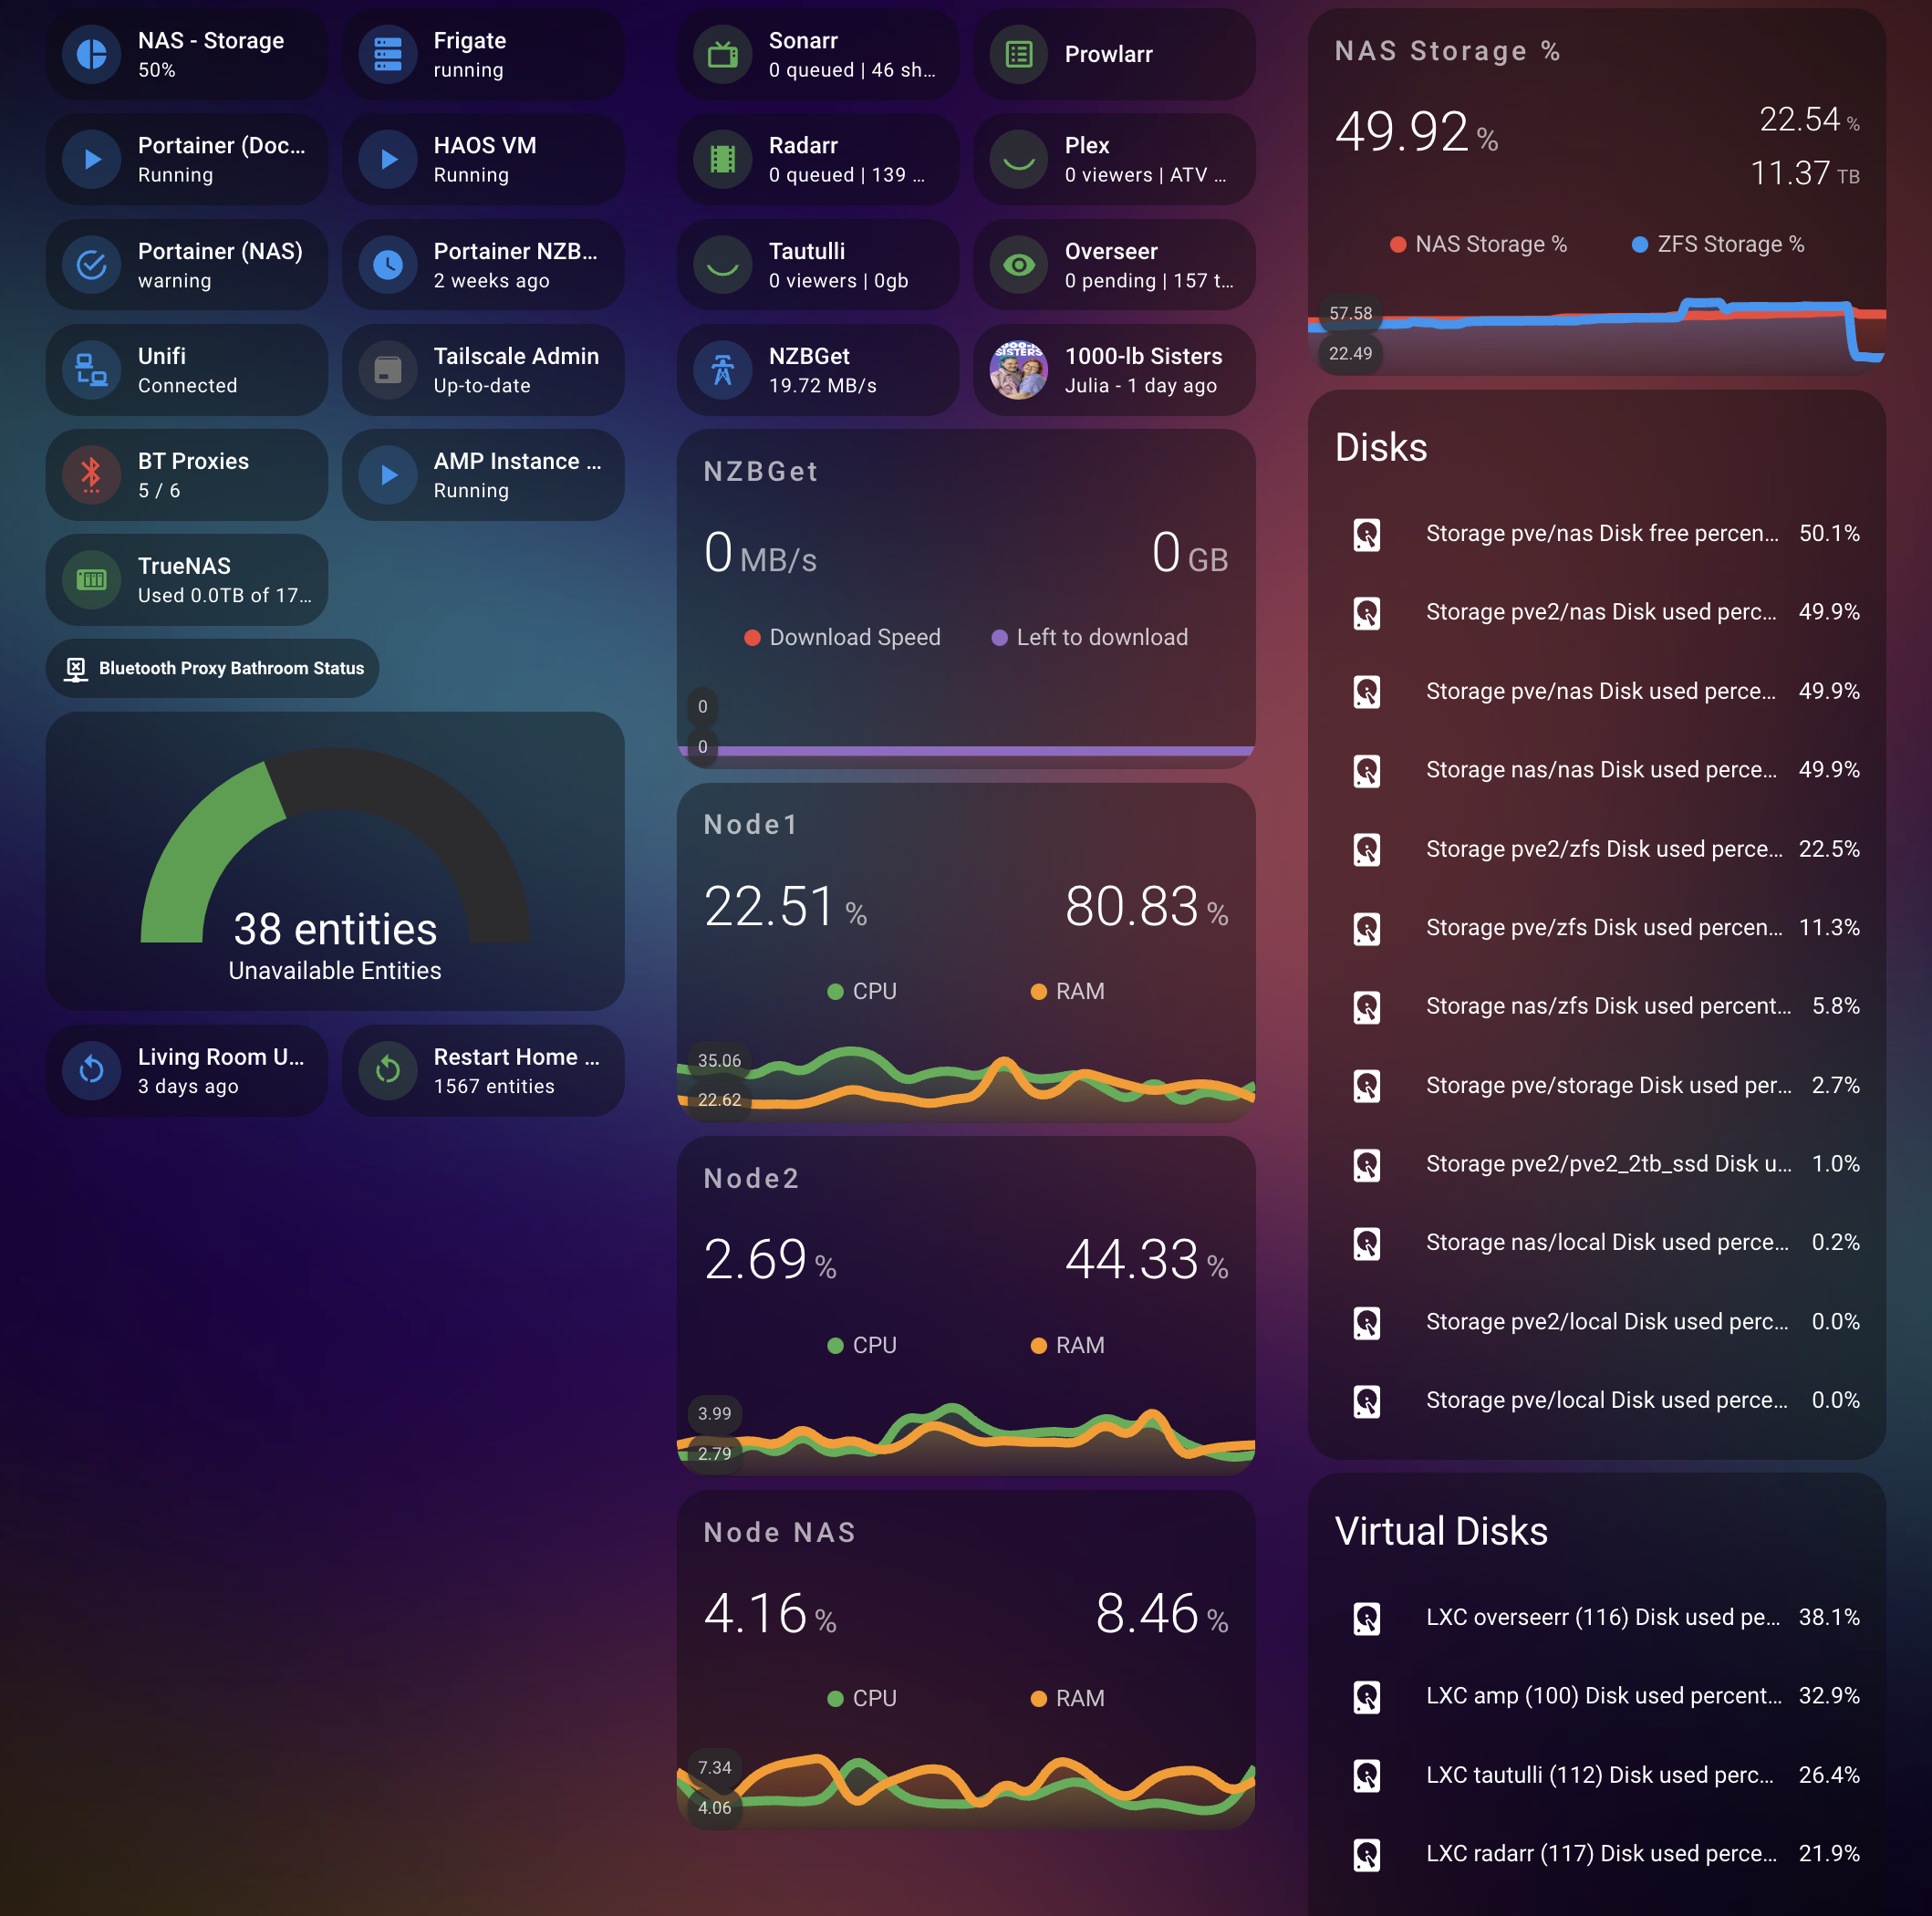 Homelab Dashboard
I've split the page into three columns, broadly:
- General services
- *Arr Stack and Nodes
- Storage and hard drives
I've tried to get each of the cards to show some meaningful status about the service it displays. Clicking on each card takes you to the Web UI of the given app, which in Arc opens a new temporary overlay window which is useful.
I also wanted to provide some quick actions for troubleshooting:
- Number of offline Home Assistant entities (colour coded showing acceptable ranges)
- Restart button for Unifi U7-Pro router (was having a lot of issues with it)
- Restart button for Home Assistant itself
There are a number of auto entities cards to show information when relevant:
- Bluetooth proxy device statuses
- Active Plex clients
- Proxmox physical disks
- Proxmox virtual disks
3D Printer
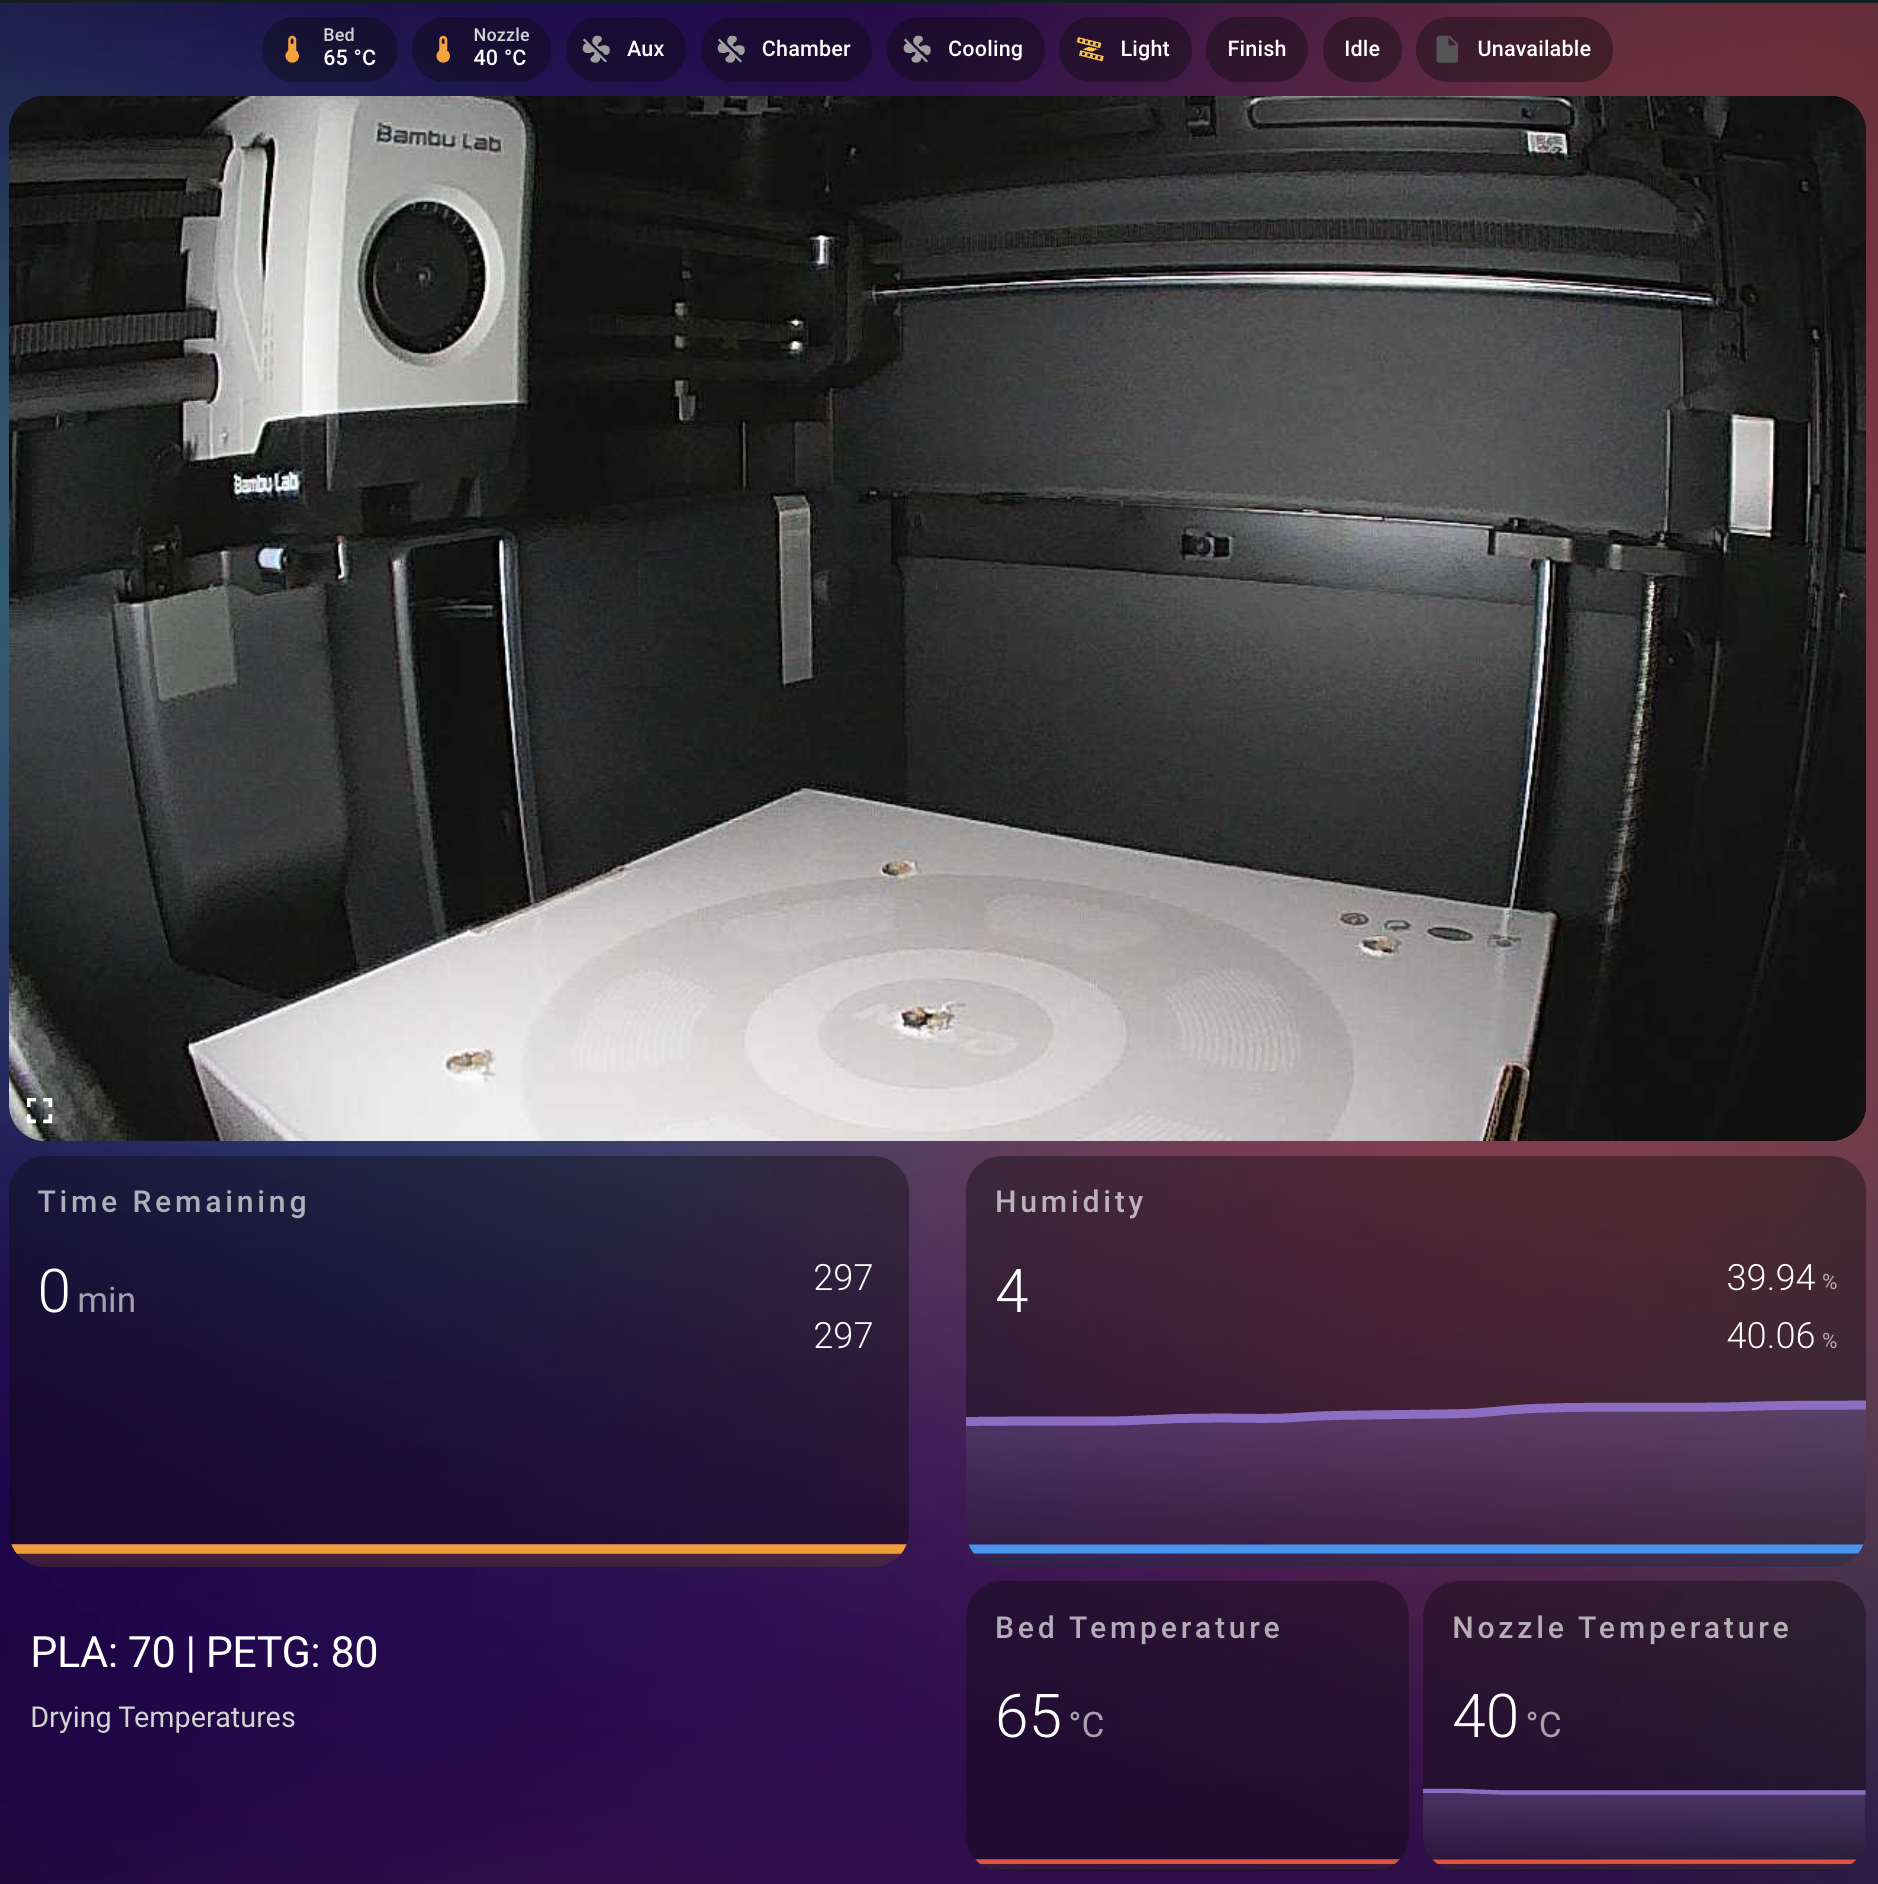 3D Printer Dashboard
The 3D printer dashboard works with the ha-bambulab Integration and my BambuLab P1S 3D printer, and allows me to check status and time remaining of active prints. I can also control some settings like fans and the light.
Unfortunately if you connect to your printer via the cloud (which is required for using the useful Bambu Handy app), you can't set bed or nozzle temperatures from Home Assistant. This'd be handy to set up the right bed temperature and fan for filament drying.
Automations
Notifications
- Dishwasher or Washing Machine has finished (Calculated when power draw drops below threshold)
- Dehumidifer is full (Calculated when power draw drops below threshold)
- Requested content from Overseerr is now available in Plex (Overseerr calls HA webhook)
- Front Door is unavailable (When Bluetooth or the lock itself are offline)
Presence
- Bathroom Presence turns on lights, fan and rotates PTZ cat camera to face wall
- Office Presence turns on lights
- Bedroom Presence turns on lights when not in Sleep Time
Switches
- Handles button presses from the LIFX Switches in each room
- Flic button next to bed turns off all lights on single press; and turns on fan on double press. Flic button is integrated by sending an Internet Request, which I make hit a webhook URL which is a Home Assistant automation trigger. Make sure these are both set to the same request type eg GET
- Philips Hue Dial actions (change TV volume, turn on lights, turn on TV, open intercom)
Other
- Show 3D print time remaining on Lametric Time screen
- Request live train departure times for my closest train station every 1 minute and put into a text variable
- Turn on 🌴 Holiday Mode to disable all automations tagged with
Disbale on Holiday - Populate "Unavailable Entities"
Hardware recommendations
Should this go in hardware section?
Tips and tricks
Escape out of the HAOS console
Run login
Running out of space?
Go to the Console of the HAOS VM in Proxmox, and type login to escape out of the HAOS CLI. Then run du -sh */ to see the size of each folder in the current directory. Keep navigating down to find the biggest folders.
Common culprits
/mnt/data/supervisor/addons/data-> esphome build cache. Can clean up by going to esphome device builder addon, clicking on a device's 3 dots and "Clean build files"/mnt/data/supervisor/backup-> nothing to clean up here/mnt/data/supervisor/homeassistant-> can delete any "corrupt" files
Identify broken automations etc.
Use Spook
Updating Home Assistant docker manually (Debian)
sudo docker pull ghcr.io/home-assistant/home-assistant:stablesudo docker stop homeassistantsudo docker rm homeassistantsudo docker run -d --name homeassistant --restart=unless-stopped --privileged -e TZ=MY_TIME_ZONE -v /home/sam/ha-config:/config -v /run/dbus:/run/dbus:ro --network=host ghcr.io/home-assistant/home-assistant:stable
Custom SSH script to expose zpool status information
- command: /usr/sbin/zpool list -H -o capacity Pool | awk '{print $1}' | tr -d '%'
  scan_interval: 600
  sensors:
    - key: zpool_capacity
      name: Zpool Capacity
      type: number
      unit_of_measurement: "%"
- command: /usr/sbin/zpool list -H -o free Pool | sed 's/T//'
  scan_interval: 600
  sensors:
    - key: zpool_free
      name: Zpool Free
      type: number
      unit_of_measurement: TB
- command: /usr/sbin/zpool list -H -o size Pool | sed 's/T//'
  scan_interval: 3600
  sensors:
    - key: zpool_size
      name: Zpool Size
      type: number
      unit_of_measurement: TB
- command: /usr/sbin/zpool list -H -o allocated Pool | sed 's/T//'
  scan_interval: 600
  sensors:
    - key: zpool_allocated
      name: Zpool Allocated
      type: number
      unit_of_measurement: TB
- command: /usr/sbin/zpool list -H -o health Pool
  scan_interval: 600
  sensors:
    - key: zpool_health
      name: Zpool Health
      type: text
Custom integrations
- CubeCoders AMP
- VicEmergency
TODO
- Switch manager for dials? https://github.com/Sian-Lee-SA/Home-Assistant-Switch-Manager